Assignment 2
Questions in murrell01.R:
plot(pressure, pch=16) # Can you change pch?
Yes, you can change pch. Pch is short for plot character and sets the character that will be plotted in R functions. Changing the pch alters the points of the plotline to different shapes like solid or empty circles or even squares.
points(x, y1, pch=16, cex=2) # Try different cex value?
Cex changes the size of the plots on the plotline. A larger cex value will produce larger points on the plot line.
axis(1, at=seq(0, 16, 4)) # What is the first number standing for?
This function is used to add an axis to a chart. The 1 indicates side = 1, which is the x axis. Side = 2 would be the y axis.The at parameter specifies the position of the labels and the seq refers to the sequence function. This seq function says we want a label on the x axis every 4 increments starting at 0 and ending at 16.
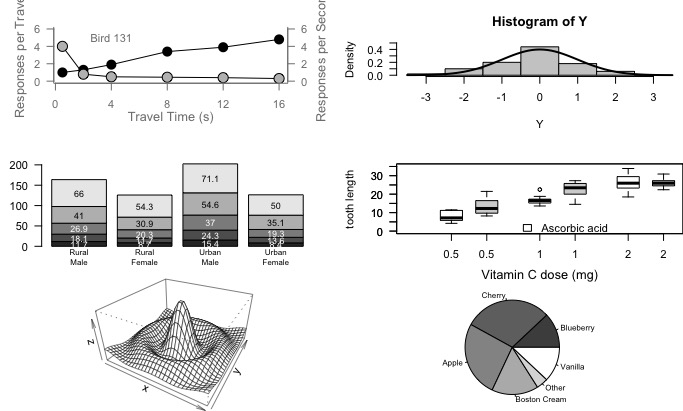
Here are the graphs from murrell01.R:
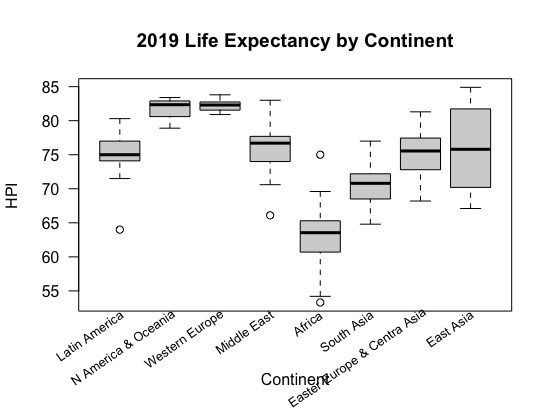
Here is an example of a boxplot graph using the Happy Planet Data Set: